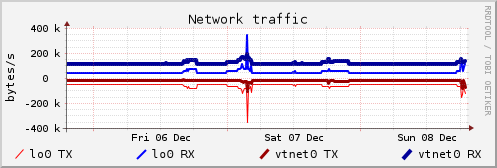
From Prometheus to RRDtool graphs
For a long time, I wanted to make RRD-style graphs from data that comes from a more modern time series database, such as Prometheus.
Unfortunately,
rrdtool graph has no option to simply read data from CSV files,
so at first it sounded pretty hard to do.
However,
I have found that RRDtool has an option to use libdbi,
a crusty database layer that can read data from SQLite.
(Bad news however: FreeBSD ports don't enable libdbi for RRDtool,
you'll need to compile it yourself.)
I have therefore implemented this contraption that would make Rube Goldberg proud:
- Extract Prometheus data as JSON
- Convert the JSON to CSV
- Load the CSV into a SQLite table
- Let RRDtool graph from the SQLite table
Let's go over the steps in more detail:
Prometheus has a quite simple to use HTTP API, but it only returns JSON. Let's get 3 days worth of traffic data out of a host:
PROMURL=http://localhost:9010/
QUERY='(irate(node_network_transmit_bytes_total{instance="..."}[5m]))*8'
START="-3d"

curl -sL $PROMURL/api/v1/query_range -d "query=$QUERY" -d "start=$START" -d 'step=5m'
The JSON contains some objects in .data.result which have the metrics details in .metrics and timestamp-value pairs in .values. After puzzling over jq(1) for bit, I came up with this:
jq -r '.data.result[] | .metric.device as $device | .values[] | [.[0],$device,(.[1] | tonumber)] | @csv'
Luckily, jq(1) has the @csv feature to convert an array into a line of CSV.
Next, we need to load the data into SQLite. Two things are important here: The table must be created with proper types, else libdbi will fail to make sense of it later, and there's the trick of using '|cat -' as import file name to read from standard input (long time camel riders will appreciate this feature).
sqlite3 data.db \
    "drop table if exists rrdvalues;" \
    "create table rrdvalues(ts integer, dev text, value real);" \
    ".separator ," \
    ".import '|cat -' rrdvalues"
Just pipe these three steps together and you'll have a table of your query result.
Finally, rrdtool needs to be taught how to use the database. For this, we define a variable first:
DS_BASE="sql//sqlite3/dbname=data.db/sqlite3_dbdir=./rrdminstepsize=15//rrdvalues/ts/value/"
This will open the database data.db in the current directory (if you forget to set sqlite3_dbdir it will try to find the file somewhere else where it definitely isn't...). The rrdminstepsize defines the minimum step size between measurements, I have put the Prometheus scraping interval here. After two slashes, we write: the name of the table, the name of the timestamp column, and the name of the value column. Finally, another slash is needed else it fails to parse the string. We can append more key=value pairs, which end up as WHERE queries, so we'll use this to fiddle out the different devices.
Now, we can call rrdtool graph:
DS_BASE="sql//sqlite3/dbname=data.db/sqlite3_dbdir=./rrdminstepsize=15//rrdvalues/ts/value/"
DS_BASE2="sql//sqlite3/dbname=data.db/sqlite3_dbdir=./rrdminstepsize=15//rrdvalues2/ts/value/"
rrdtool graph traffic.png \
    --dynamic-labels \
    --slope-mode \
    --title="Network traffic" \
    --vertical-label="bytes/s" \
    --start="$START" --end=+5min \
    "DEF:txlo0=$DS_BASE/dev=%27lo0%27:max:MAX" \
    "CDEF:txlo0neg=txlo0,-1,*" \
    "LINE1:txlo0neg#FF0000:lo0 TX" \
    "DEF:rxlo0=$DS_BASE2/dev=%27lo0%27:max:MAX" \
    "LINE2:rxlo0#0000FF:lo0 RX" \
    "DEF:txvtnet0=$DS_BASE/dev=%27vtnet0%27:max:MAX" \
    "CDEF:txvtnet0neg=txvtnet0,-1,*" \
    "LINE3:txvtnet0neg#990000:vtnet0 TX" \
    "DEF:rxvtnet0=$DS_BASE2/dev=%27vtnet0%27:max:MAX" \
    "LINE4:rxvtnet0#000099:vtnet0 RX"
(Here, I'm plotting data from two queries, so it got a bit more complicated.)
Note how we need %27 to escape ' for the WHERE query.
This is how it looks like:

So as you can see, it's not exactly straight-forward to make plots from Prometheus. But it still seems easier than trying to generate static images out of Grafana, for example...